Description
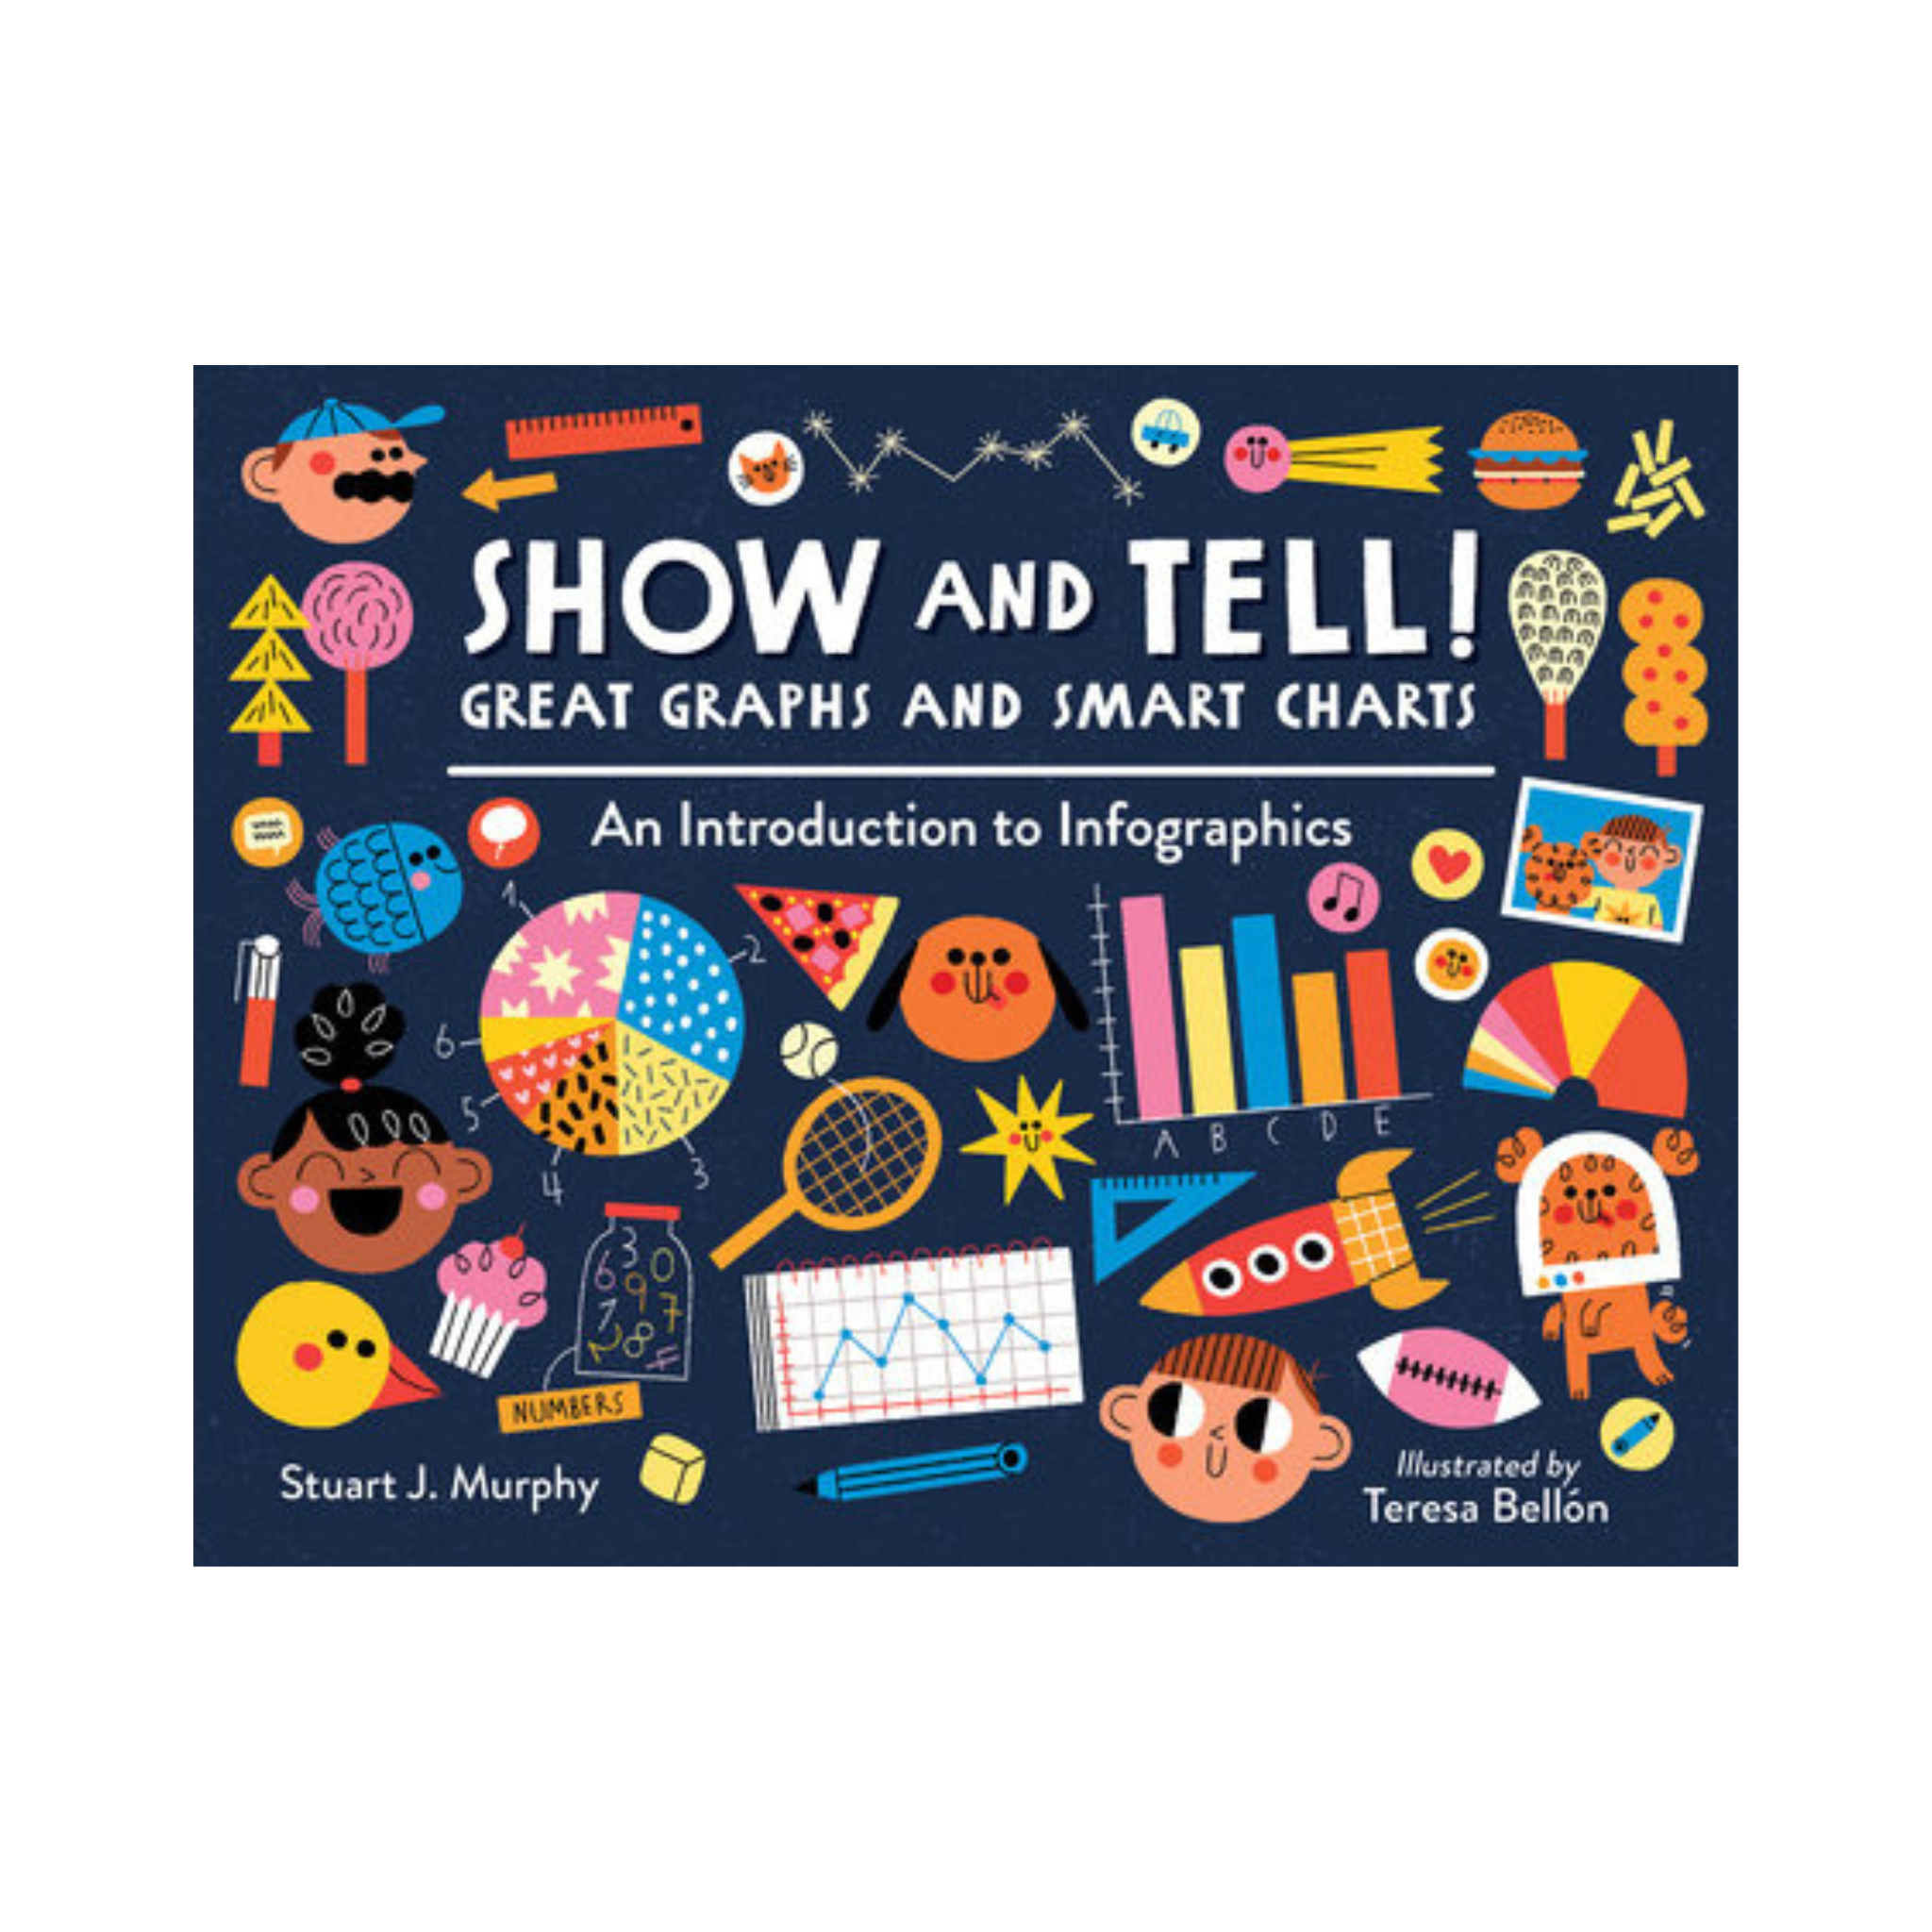
A visual-learning expert races up the charts and graphs math success with kid-friendly content sure to help with homework.
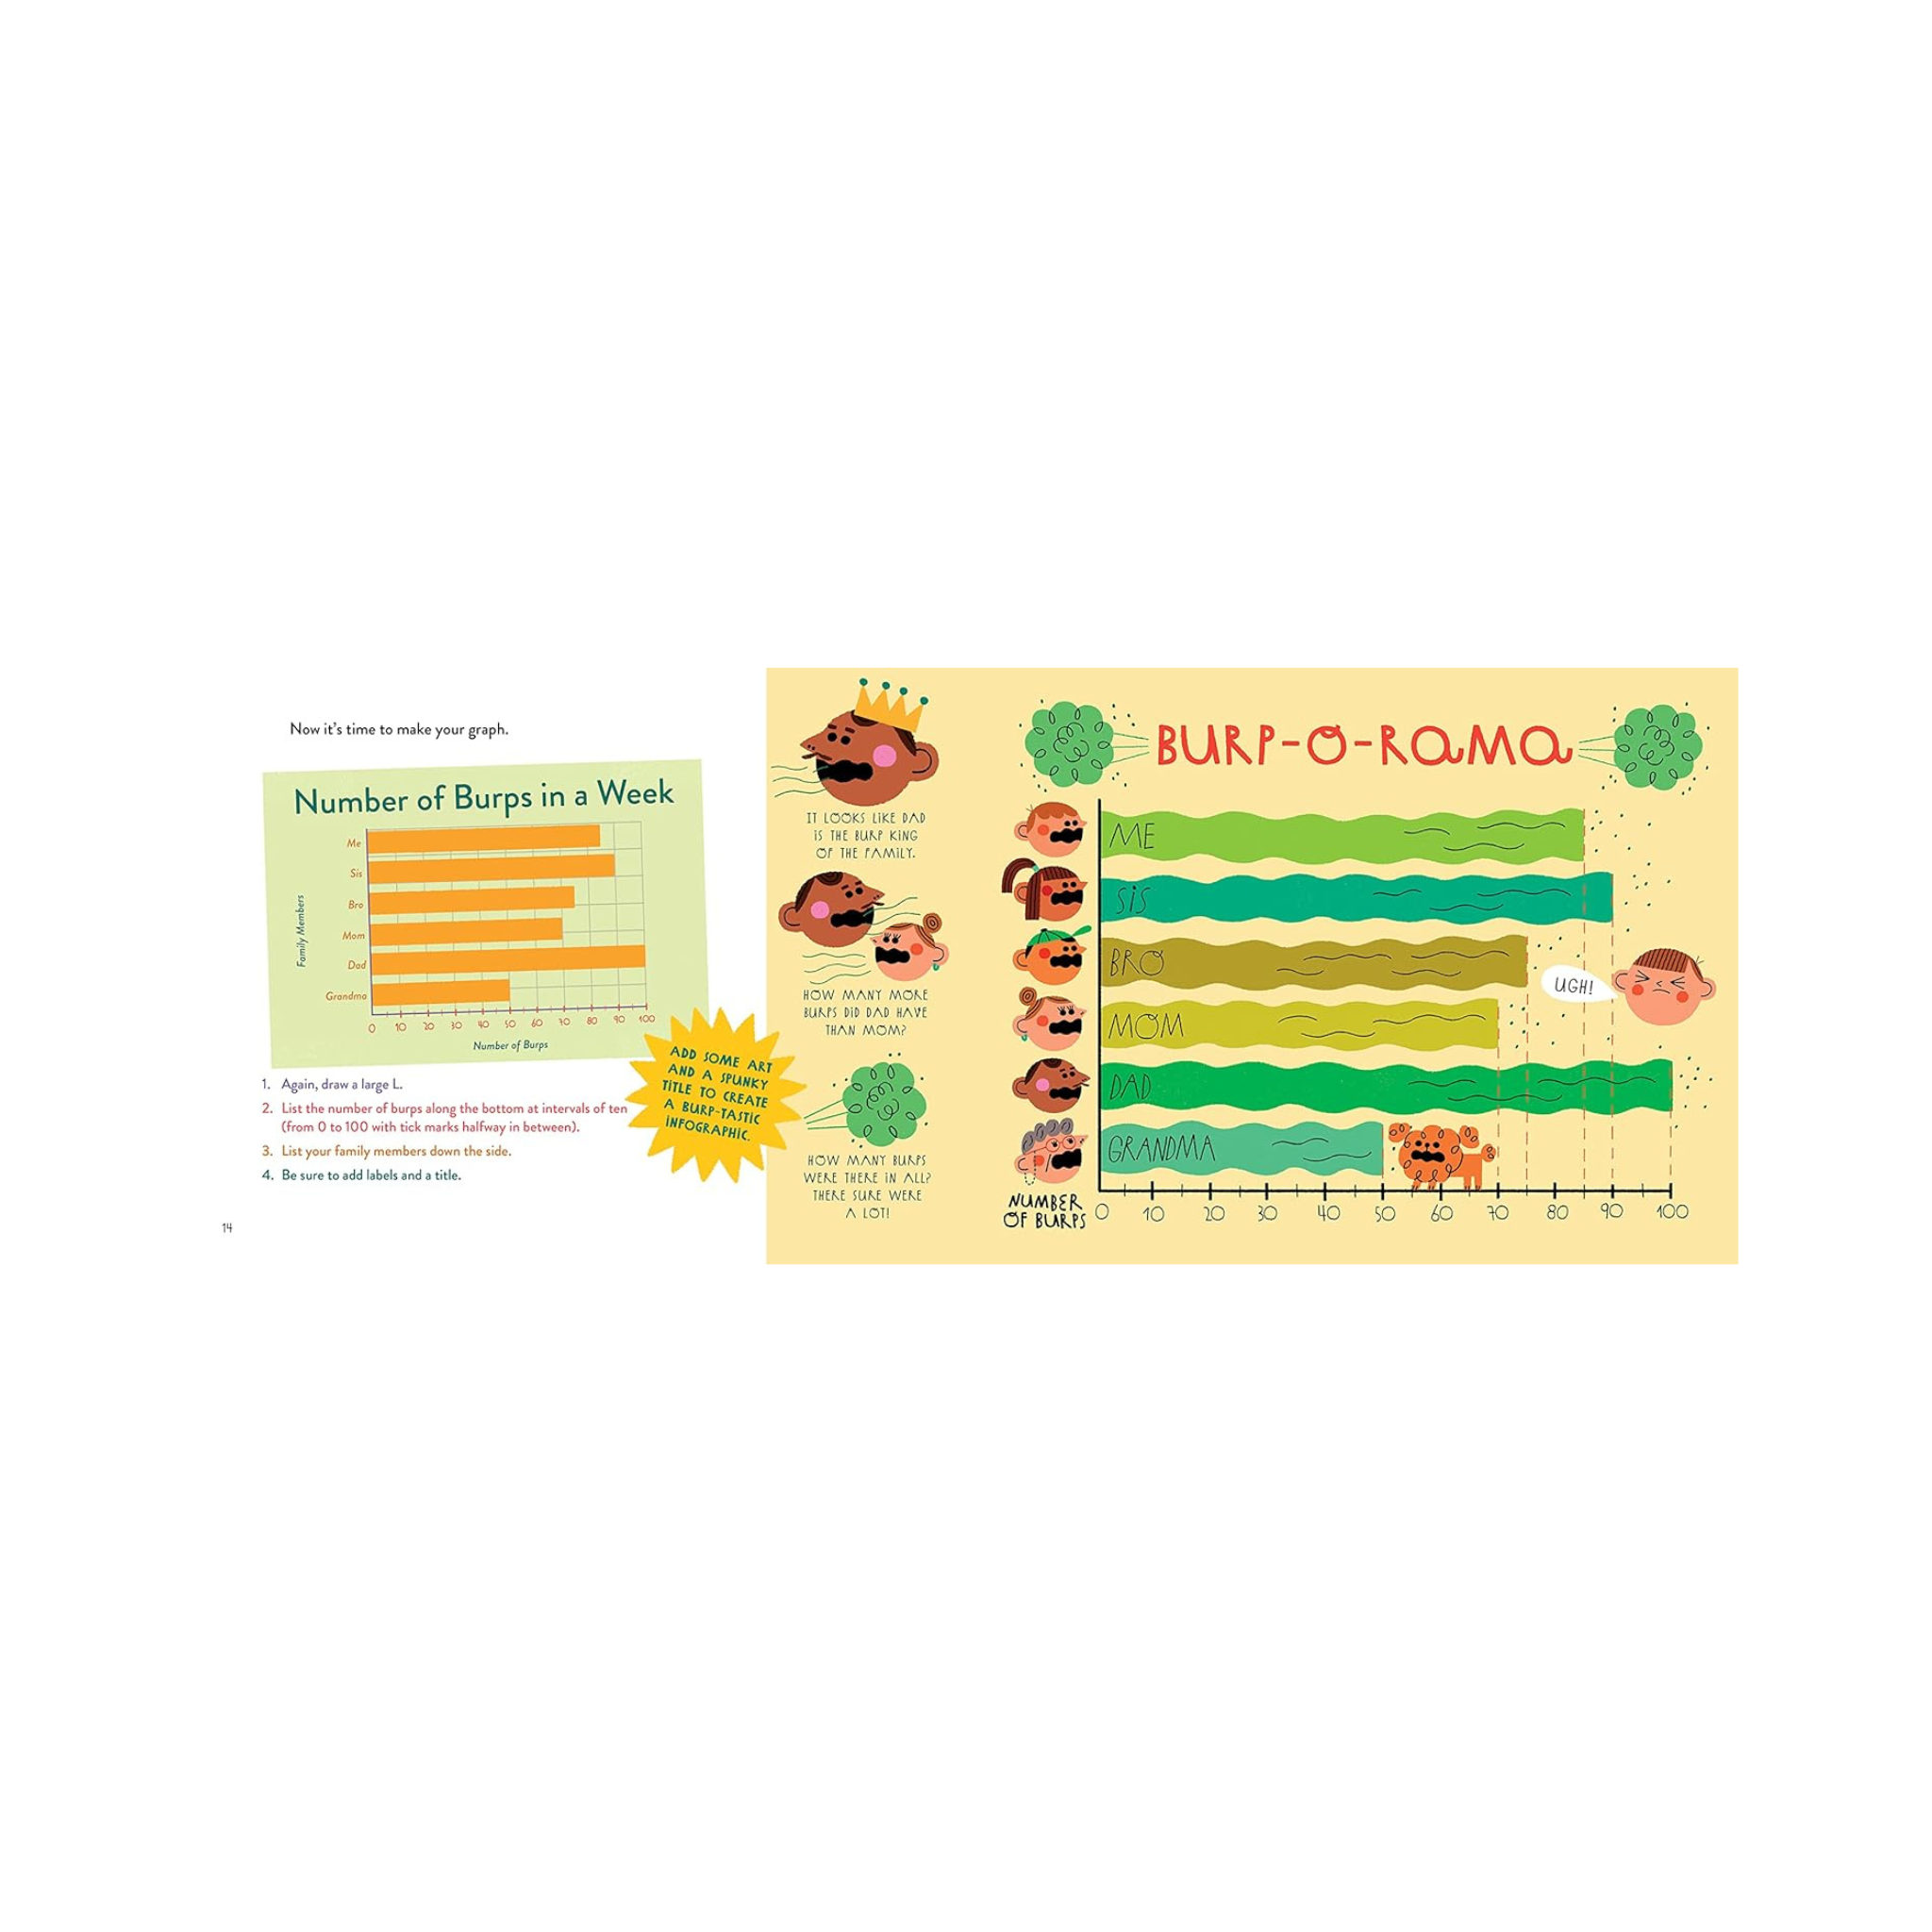
Each project shows how to build a chart or graph and ties it all together with a creative infographic that really puts the A in STEAM (Science, Technology, Engineering, ARTS, and Mathematics).
Whether used as an introductory aid or to underscore previous knowledge, the book prepares today’s visually savvy children to succeed in school and life by analyzing the world around them.
***
This book is a part of Kate’s Homeschool Math Help Fourth Grade Math with Confidence picture book list.
All other math titles from her lists can be viewed here.